Section V.1. GUI
Default
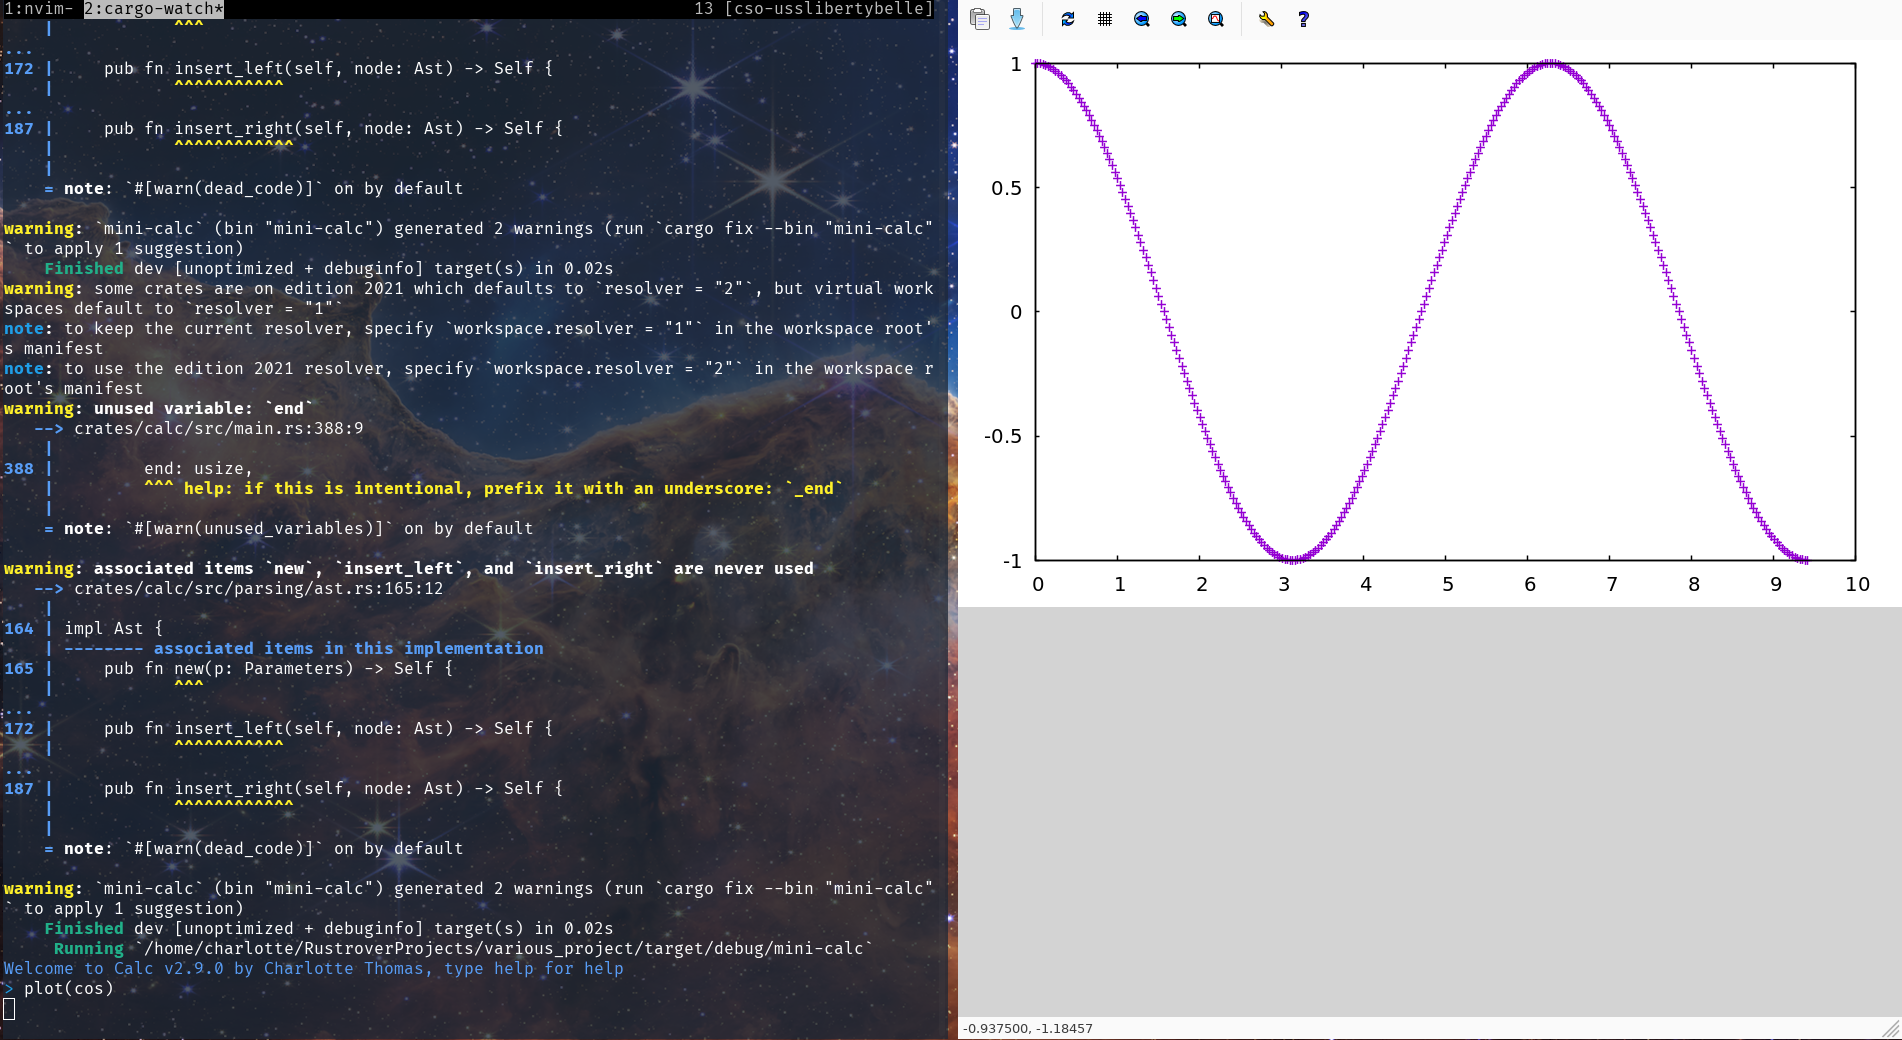
To plot a function f you just need to do plot(f)
Options
You can pass parameters to the function.
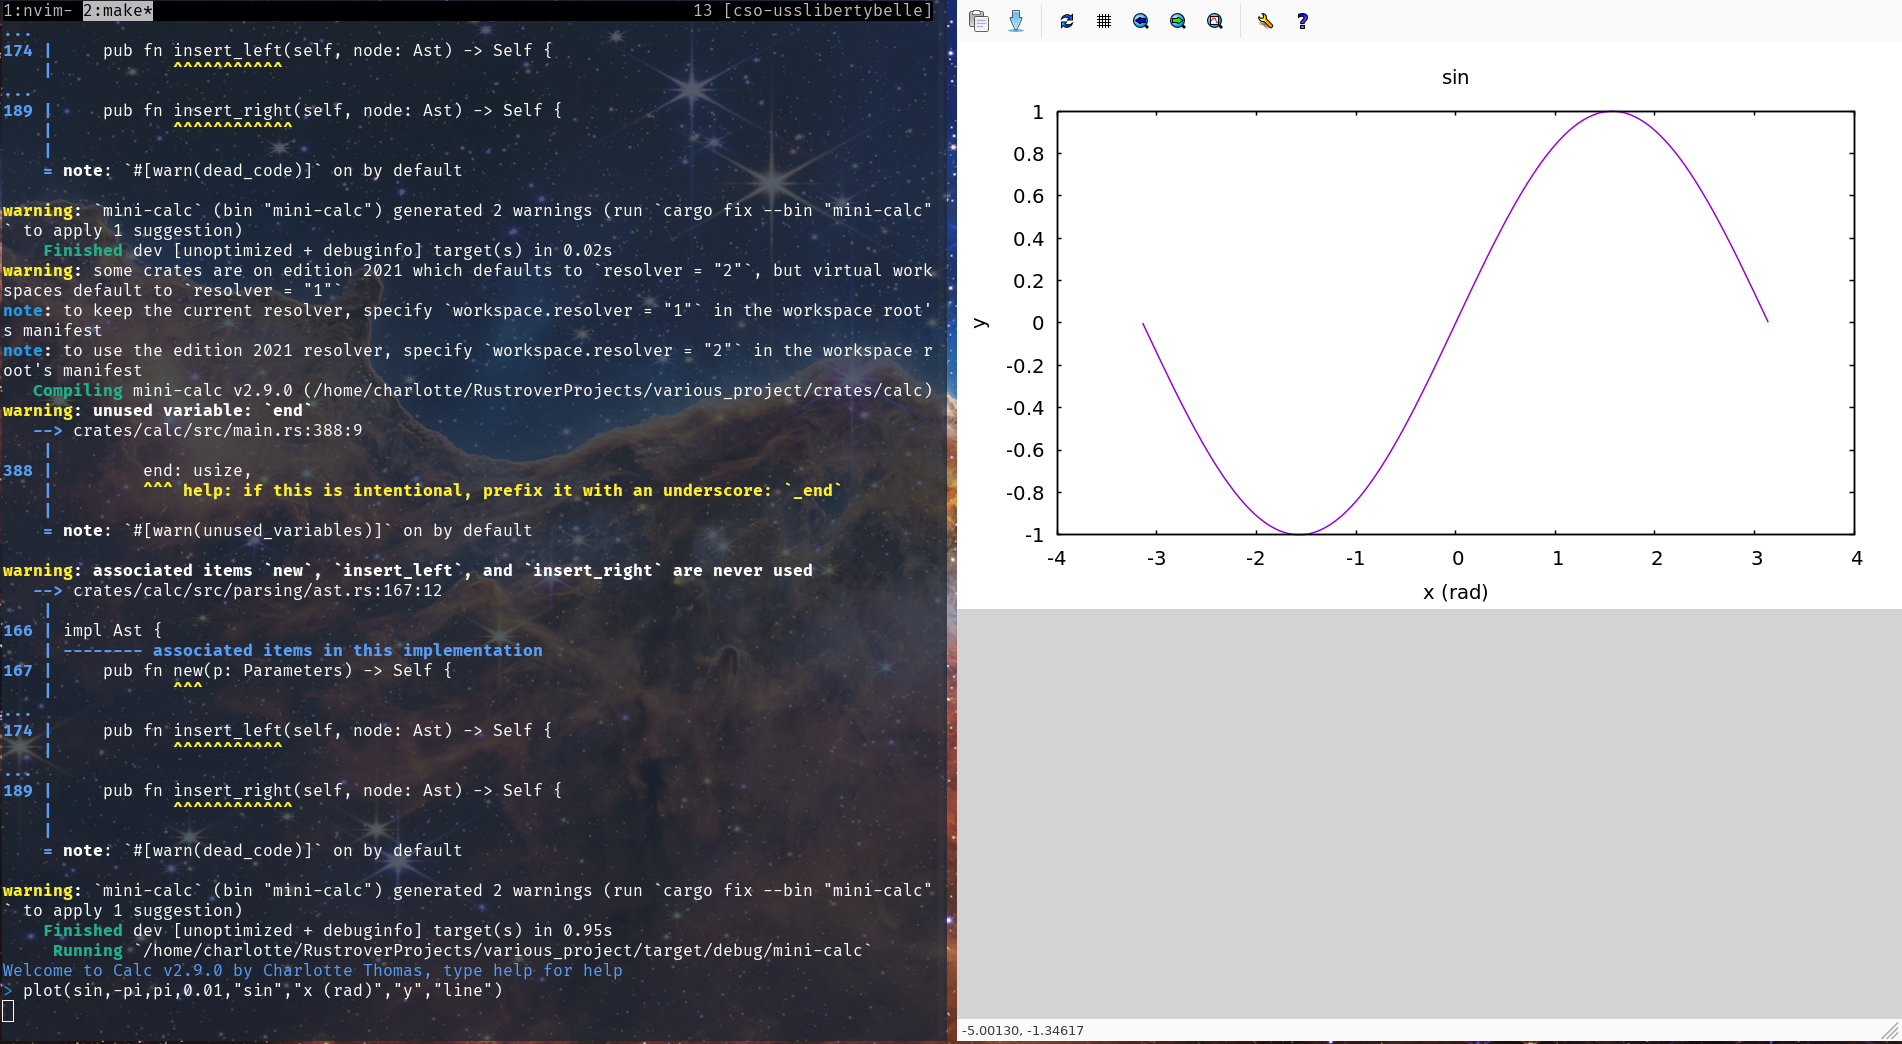
> plot(sin,-pi,pi,0.01,"sin","x(rad)","y","line")
Let's unpack, we have ploting the sin function, from x=-pi to x=pi
with a step of 0.01 rad, the title of the graph is sin, the x_axis
label is x(rad), the y_axis label is y and we want a line.
User-defined functions
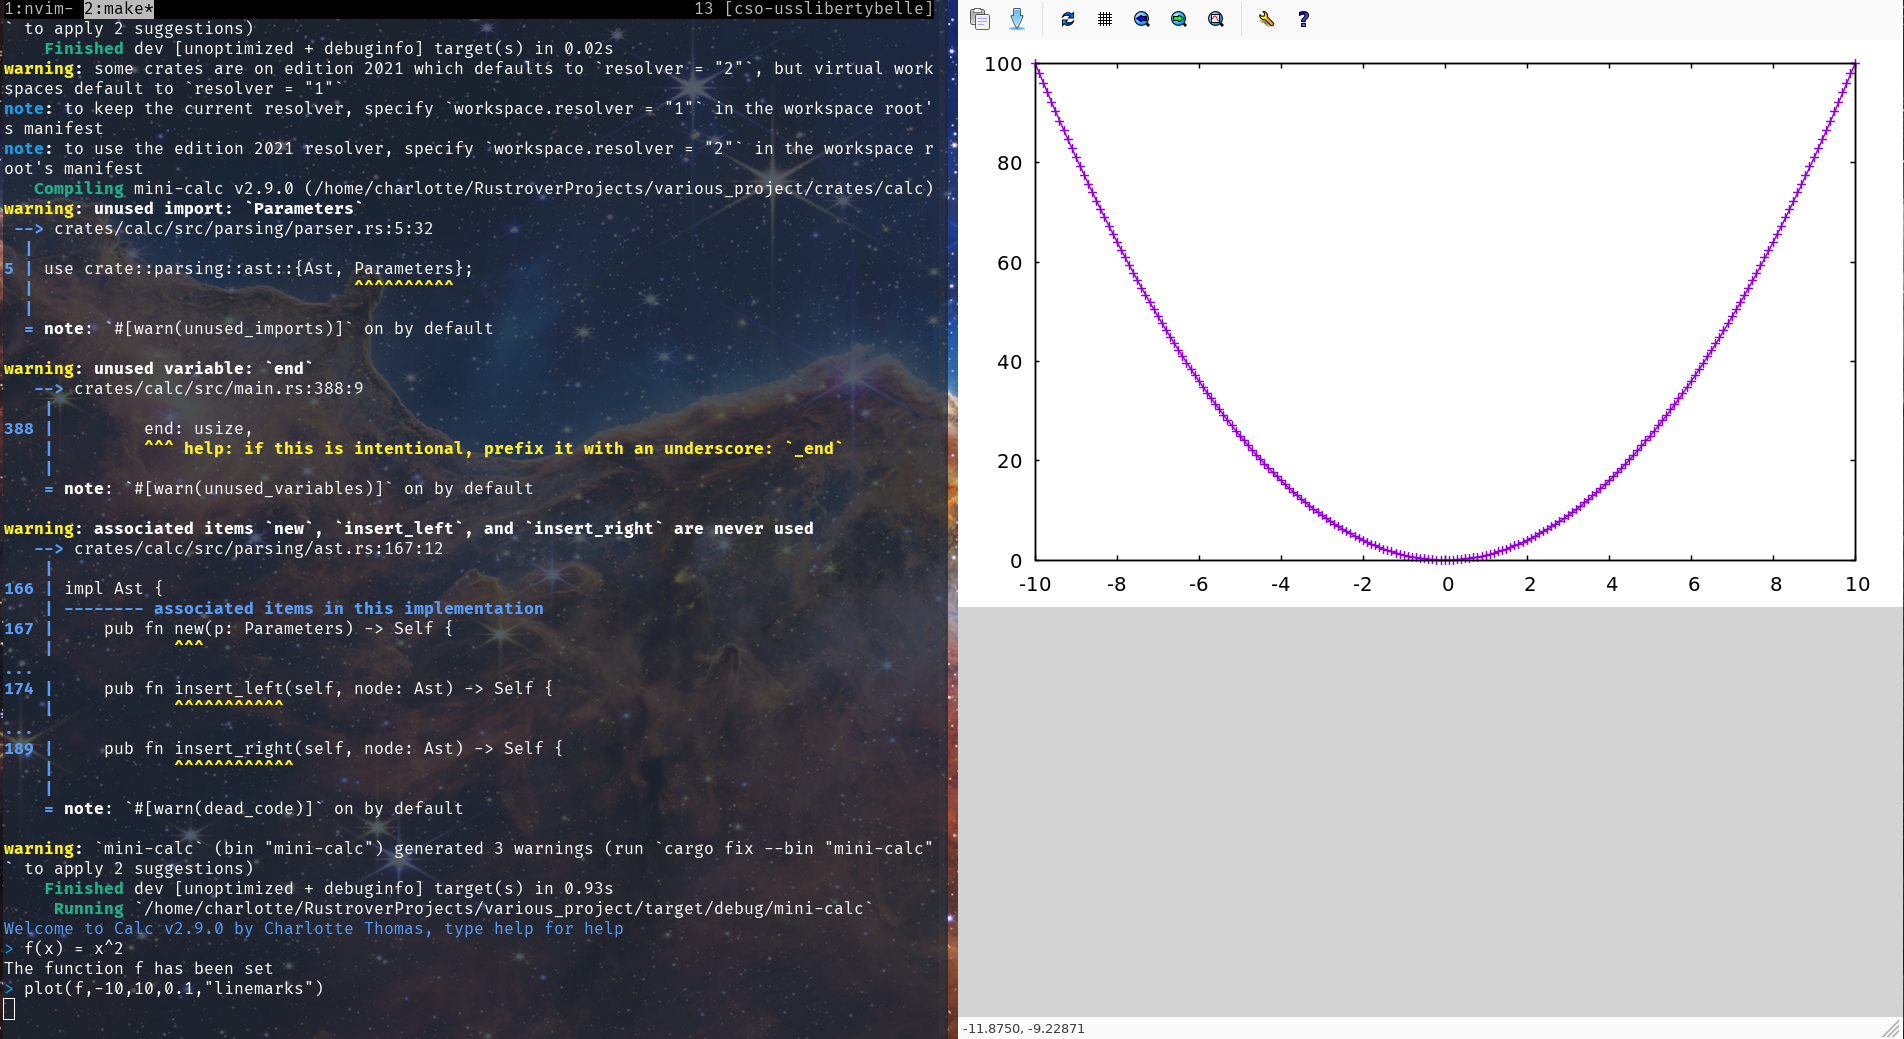
You can plot your own functions with the same call.
Here is the example for f(x) = x*x